Read the chips.
See the system.
Annual reports on the ideas reshaping compute—and the questions that matter to those who design, build and buy it.
Ten years of Q&A evidence
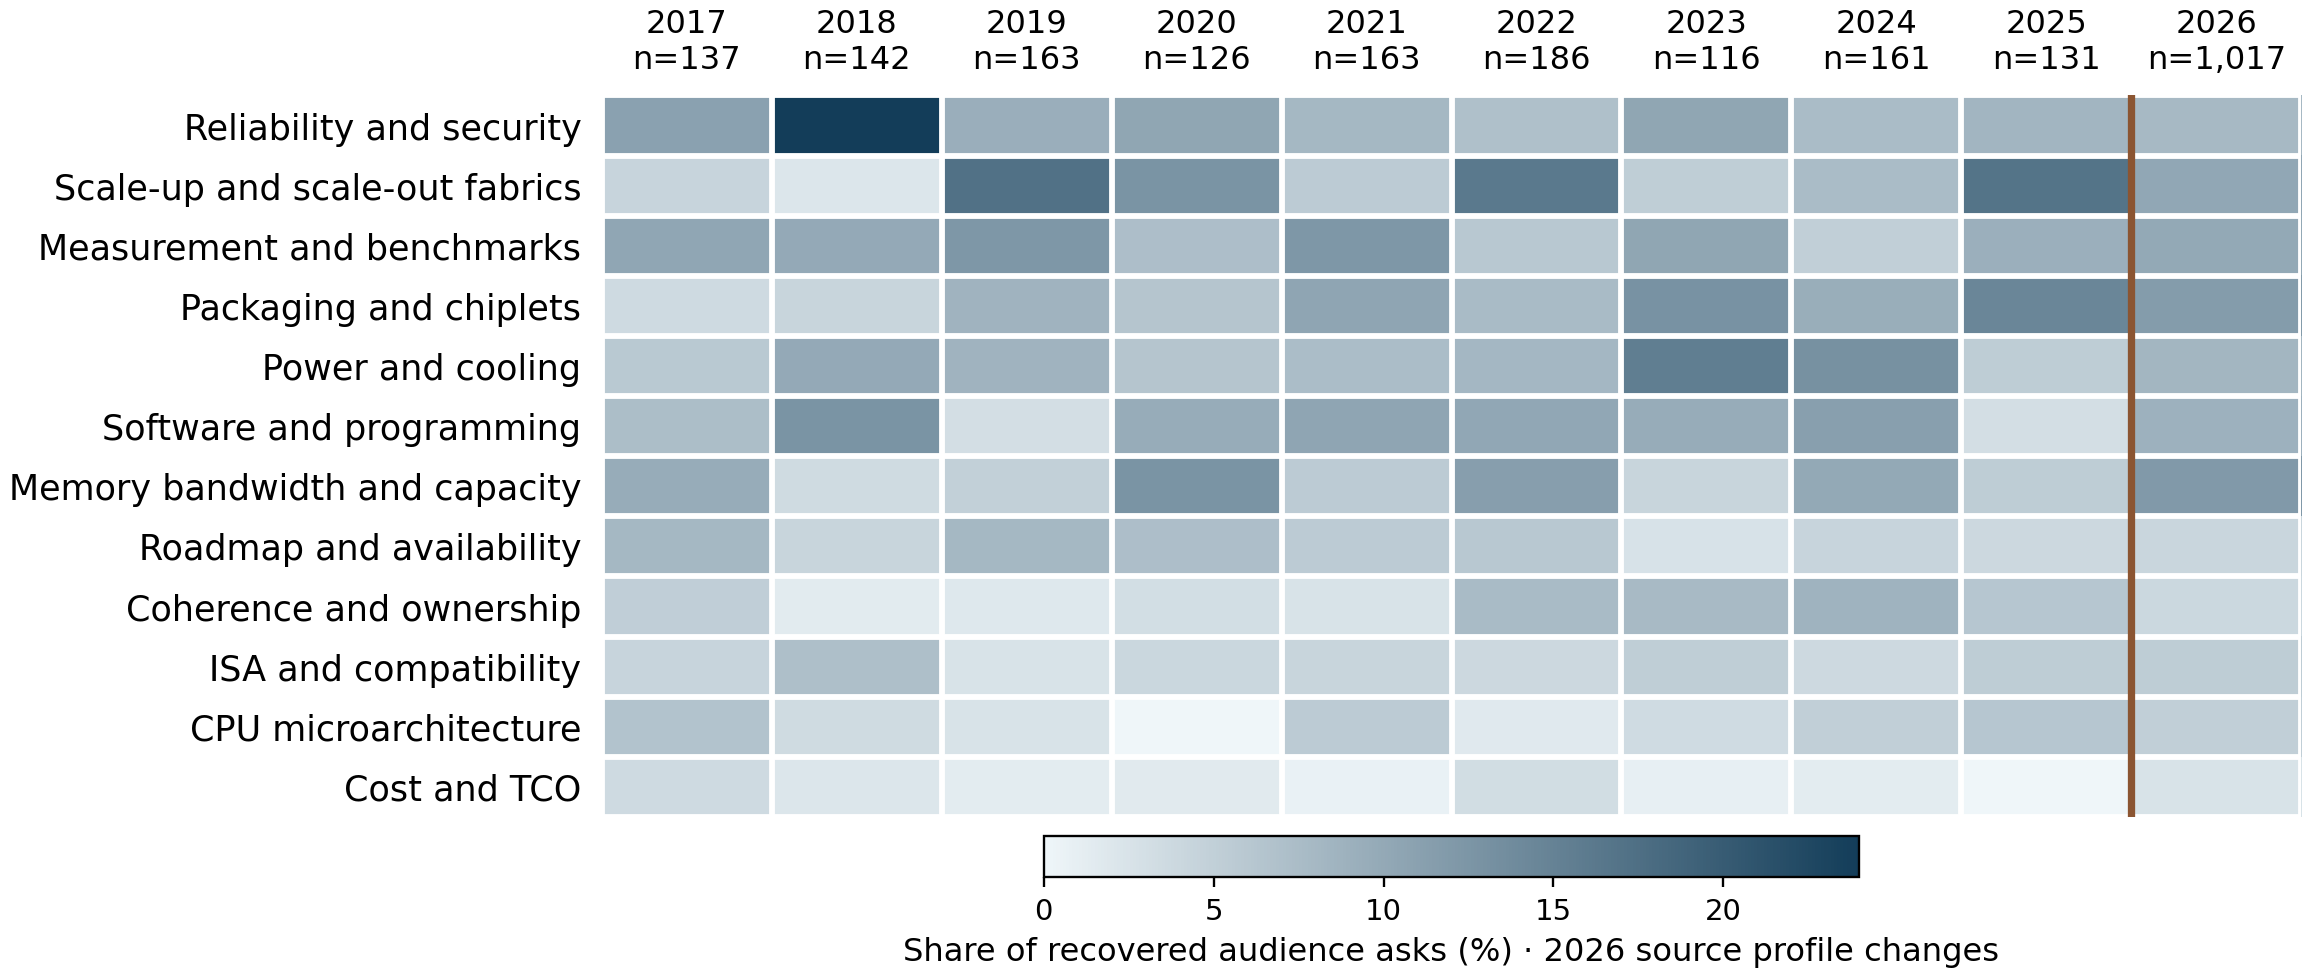
2017–2026 / descriptive comparisonDarker cells show a larger share of the reviewed audience asks in that year. The new 2017–2021 reviews use official YouTube captions;2026 retains the earlier mixed-source aggregate. Hover or focus a cell for its exact count and share.
| Theme | 2017n = 137 | 2018n = 142 | 2019n = 163 | 2020n = 126 | 2021n = 163 | 2022n = 186 | 2023n = 116 | 2024n = 161 | 2025n = 131 | 2026n = 1,017 · mixed source |
|---|---|---|---|---|---|---|---|---|---|---|
| Reliability and security | 15 / 137 (10.9%) | 34 / 142 (23.9%) | 15 / 163 (9.2%) | 13 / 126 (10.3%) | 13 / 163 (8.0%) | 13 / 186 (7.0%) | 12 / 116 (10.3%) | 12 / 161 (7.5%) | 11 / 131 (8.4%) | 80 / 1017 (7.9%) |
| Scale-up and scale-out fabrics | 6 / 137 (4.4%) | 3 / 142 (2.1%) | 28 / 163 (17.2%) | 16 / 126 (12.7%) | 9 / 163 (5.5%) | 30 / 186 (16.1%) | 6 / 116 (5.2%) | 12 / 161 (7.5%) | 22 / 131 (16.8%) | 103 / 1017 (10.1%) |
| Measurement and benchmarks | 14 / 137 (10.2%) | 14 / 142 (9.9%) | 20 / 163 (12.3%) | 9 / 126 (7.1%) | 20 / 163 (12.3%) | 11 / 186 (5.9%) | 12 / 116 (10.3%) | 8 / 161 (5.0%) | 12 / 131 (9.2%) | 102 / 1017 (10.0%) |
| Packaging and chiplets | 5 / 137 (3.6%) | 6 / 142 (4.2%) | 14 / 163 (8.6%) | 8 / 126 (6.3%) | 17 / 163 (10.4%) | 14 / 186 (7.5%) | 15 / 116 (12.9%) | 15 / 161 (9.3%) | 19 / 131 (14.5%) | 119 / 1017 (11.7%) |
| Power and cooling | 8 / 137 (5.8%) | 14 / 142 (9.9%) | 14 / 163 (8.6%) | 8 / 126 (6.3%) | 12 / 163 (7.4%) | 15 / 186 (8.1%) | 18 / 116 (15.5%) | 21 / 161 (13.0%) | 7 / 131 (5.3%) | 84 / 1017 (8.3%) |
| Software and programming | 10 / 137 (7.3%) | 18 / 142 (12.7%) | 5 / 163 (3.1%) | 12 / 126 (9.5%) | 17 / 163 (10.4%) | 19 / 186 (10.2%) | 11 / 116 (9.5%) | 18 / 161 (11.2%) | 4 / 131 (3.1%) | 90 / 1017 (8.8%) |
| Memory bandwidth and capacity | 13 / 137 (9.5%) | 5 / 142 (3.5%) | 8 / 163 (4.9%) | 16 / 126 (12.7%) | 9 / 163 (5.5%) | 21 / 186 (11.3%) | 5 / 116 (4.3%) | 16 / 161 (9.9%) | 7 / 131 (5.3%) | 122 / 1017 (12.0%) |
| Roadmap and availability | 11 / 137 (8.0%) | 6 / 142 (4.2%) | 13 / 163 (8.0%) | 9 / 126 (7.1%) | 9 / 163 (5.5%) | 11 / 186 (5.9%) | 3 / 116 (2.6%) | 7 / 161 (4.3%) | 5 / 131 (3.8%) | 42 / 1017 (4.1%) |
| Coherence and ownership | 7 / 137 (5.1%) | 2 / 142 (1.4%) | 3 / 163 (1.8%) | 4 / 126 (3.2%) | 4 / 163 (2.5%) | 14 / 186 (7.5%) | 9 / 116 (7.8%) | 14 / 161 (8.7%) | 8 / 131 (6.1%) | 40 / 1017 (3.9%) |
| ISA and compatibility | 6 / 137 (4.4%) | 10 / 142 (7.0%) | 4 / 163 (2.5%) | 5 / 126 (4.0%) | 7 / 163 (4.3%) | 7 / 186 (3.8%) | 6 / 116 (5.2%) | 6 / 161 (3.7%) | 7 / 131 (5.3%) | 54 / 1017 (5.3%) |
| CPU microarchitecture | 9 / 137 (6.6%) | 5 / 142 (3.5%) | 4 / 163 (2.5%) | 0 / 126 (0.0%) | 9 / 163 (5.5%) | 3 / 186 (1.6%) | 4 / 116 (3.4%) | 8 / 161 (5.0%) | 8 / 131 (6.1%) | 51 / 1017 (5.0%) |
| Cost and TCO | 5 / 137 (3.6%) | 3 / 142 (2.1%) | 2 / 163 (1.2%) | 2 / 126 (1.6%) | 1 / 163 (0.6%) | 6 / 186 (3.2%) | 1 / 116 (0.9%) | 2 / 161 (1.2%) | 0 / 131 (0.0%) | 25 / 1017 (2.5%) |
Counting rules and comparison limits
One independently answerable technical ask, one primary theme. Moderator prompts, unclear origins and unintelligible asks are excluded from the new historical heatmaps. Missing captions are absent evidence, never zero. Tutorials and keynotes are included in 2017–2021; later source populations and question opportunities differ. No new Slack content was accessed.
Share = primary-theme asks ÷ all eligible audience asks in that year. These twelve shared themes omit other primary families, so displayed shares do not sum to100%. Rows rank by mean within-year share, giving each year equal weight. Exact residual counts and source profiles appear in the data download. The2026 aggregate combines prior Slack and live-Q&A evidence; source changes and caption/attribution differences prevent a controlled industry time series.
Download exact ten-year data (CSV) · Ten-year Executive Brief · Full-resolution heatmap
2026: Evaluate the
complete serving system.
Agentic inference sharpens the question of how CPUs, accelerators, memory and networks work together.
Read the 2026 report ↗The annual reports
Ten years / official-recording history addedEvaluate the complete serving system
Agentic inference · memory · heterogeneous systems
Read annual report ↗2025Fabrics, optics and the cost of recovery
Rack design · optical fabrics · kernel programming
Read annual report ↗2024Memory topology, runtime and cooling
Generative AI · cooling · platform competition
Read annual report ↗2023Software contracts meet physical systems
Chiplets · inference · platform diversity
Read annual report ↗2022The system around the accelerator
Locality · coherence · software · power accounting
Read annual report ↗2017—26What persists. What changes.
2017–2026 · ten-year descriptive comparison
Explore the patterns ↗2021Hot Chips 33 · Official recording Q&A
Qualify the boundaries of specialization.
163 audience asks · matching Executive Brief
Read the annual report →2020Hot Chips 32 · Official recording Q&A
Useful compute needs the whole machine.
126 audience asks · matching Executive Brief
Read the annual report →2019Hot Chips 31 · Official recording Q&A
Accelerators become system choices.
163 audience asks · matching Executive Brief
Read the annual report →2018Hot Chips 30 · Official recording Q&A
Deployment depends on boundaries.
142 audience asks · matching Executive Brief
Read the annual report →2017Hot Chips 29 · Official recording Q&A
Specialization needs a system contract.
137 audience asks · matching Executive Brief
Read the annual report →Different seats. Better questions.
Presenters & sell-side architects
Make the trade-off visible. Show the workload, baseline, system boundary and conditions under which the design wins.
Organisers
Connect sessions around shared bottlenecks. Pair component innovation with deployment evidence and preserve the unanswered questions.
Buy-side architects & hyperscalers
Turn each disclosure into an evaluation question: what changes in fleet efficiency, service latency or deployment risk?
Implementors
Look for interface costs, software assumptions, verification burden and failure behaviour behind the block diagram.
Investors & analysts
Separate architectural promise from adoption evidence. Track deployment readiness, ecosystem dependencies and customer qualification.
Attendees
Read across sessions. The most consequential pattern may be the same bottleneck appearing in very different products.
Evidence before excitement.
The historical extension adds2017–2021 official-recording Q&A reviews and matching two-page Executive Briefs. The ten-year heatmap compares annual shares with explicit coverage and source limits;2026 keeps its prior mixed-source evidence. No new Slack content was accessed.
The reports now incorporate the updated 2022–2026 research synthesis, the 2023–2026 executive briefs and the final 2026 integrated Q&A assessment. The latest independent 2022 assessment adds presentation-level findings on locality, coherence, software, power and early KV buffering, now reflected in the annual report and five-year comparison.
2022 now includes a recording Q&A inventory from automatic captions, alongside presentation findings. Its 251 topical asks include chair prompts. The 2023–2025 reviews use partial captions; 2026 combines Slack with reported live Q&A. Coverage and counting differences are stated with each chart.